

QUARTERLY NEWS
QUARTER 2 2023 COMMENTARY
The Running of the Bulls (and Bears)
SUMMARY
-
The first half of 2023 has been unusual—banking crisis, a near U.S. debt default, and a surge of interest in all things Artificial Intelligence.
-
On the surface, U.S. stocks continued to push higher during the quarter. The S&P 500 ended the first half of the year up 16.9% and is now up 24.4% since its October lows, but small cap stocks, banks, and public real estate have been left behind.
-
Although several signs suggest this is a bull market, key industries and markets are grappling with telltale bear market issues.
-
Looking forward, strong cases can be made for both bull and bear scenarios.
OVERVIEW
The first half of 2023 has been anything but ordinary. We weathered a banking crisis, had a near-miss with a U.S. debt default, and experienced a flurry of excitement around anything related to Artificial Intelligence. On the surface, U.S. stock markets continued to build on the strength of the first quarter. In particular, equities posted decidedly positive returns in June. The tech-heavy Nasdaq Index wrapped up the first half of the year up 32.7%—its best first half since 1983. The S&P 500 ended the first half of the year up 16.9% and is now up 24.4% over its October 2022 lows. This is comfortably above the 20.0% mark some would consider the threshold for a new bull market (others prefer to hold back that label until new highs have been attained, and as of quarter end, the S&P 500 was still about 7.0% shy of that milestone). Despite impressive strength in the large cap indexes, parts of the market have been left behind. Small cap stocks are up just 8.1% for the year while banks are down 19.0% and public real estate (REITS) are up 4.8%.
June marked the one-year anniversary of U.S. inflation reaching its four-decade high of 9.1% (year-over-year). Since then, headline inflation has trended lower to 3.9%, while core inflation (which excludes the more-volatile food and energy components) has stayed stubbornly high, coming in at 4.9% for June. At the June FOMC meeting, the Fed held rates steady for the first time in the current hiking cycle, citing the need for the lagged effects of monetary policy to catch up.1 However, in his semiannual testimony before Congress, Fed Chairman Jerome Powell emphasized that there will be more rate hikes and quashed any hopes of rate cuts before the end of 2023:2
“A strong majority of the committee participants expect that it will be appropriate to raise interest rates two or more times by the end of the year.”3

Regardless of what we call this market, optimism has replaced the broad despair that existed last year. The widely reported American Association of Independent Investors (AAII) sentiment survey, in which respondents characterize themselves as bullish and bearish, has shifted from 18% bullish and 61% bearish in the last week of September 2022 to 46% bullish and 25% bearish in the last week of June 2023.4 This is well above the historical average for bullishness, which usually hovers around 38%. The optimism has resulted in massive flows to market winners. According to BofA Global Research, technology equity funds experienced their biggest inflows on record for the first week of June.5 This tangible swing in the mood (and behavior) of the average investor reminds of us of a quote from the renowned Bob Farrell, former Merrill Lynch head of research and market strategist:
“The public buys the most at the top and the least at the bottom.”6
The debt ceiling debate was also a defining event of the past quarter. After hitting the debt ceiling on January 26, politicians on both sides locked horns in the debate on how to raise it. With mere days before the U.S. was forecast to run out of cash, President Biden and House Speaker McCarthy finally reached a compromise. On May 30, Biden and McCarthy agreed to suspend the debt ceiling until January 1, 2025, which allows for government debt to run higher.7 Several potential implications for government finances now shift into focus. Following the debt-ceiling agreement, the U.S. Treasury Department is in the midst of a $1 trillion replenishment of its cash levels, and it will also pay back money it borrowed from other government accounts as part of its extraordinary measures.8 So far, all of the issuance has been in bills that mature in less than one year, but the Treasury will have to start issuing longer-term securities in order to maintain a balance between short- and long-term debt.
Throughout the quarter (and the first half of this year), both a strong labor market and relatively strong consumer spending have hindered the Fed’s efforts to slow the economy and bring inflation back to its 2% target. The June jobs report shows the unemployment rate is still near all-time lows, at 3.6%.9 The personal savings rate continues to tick upwards (reaching 4.6% in June), but the excess savings that U.S. consumers amassed during the pandemic—more than $2 trillion —has mostly been depleted, especially among lower income groups and younger consumers.10,11 Some estimates indicate this pool of above-trend savings will run out by September.12 The pressure on lower income consumers has also started to manifest in shifting purchasing patterns. As Walmart CFO John Rainey pointed out in a first-quarter earnings call:
“Inflation remained high, up low double digits in food categories. It's important to remember that while year-over-year inflation started to moderate as the quarter progressed, this is largely due to lapping higher levels from last year. On a two-year stack basis, food inflation remains over 20%, and continues to pressure discretionary wallets.”13
Although lower inflation is welcomed, many consumers will feel an additional hit to their ability to spend in the fall when some pandemic-era protections are eliminated. In March 2020, federal student loan payments were paused as part of COVID-19 relief efforts. Now, more than three years later, these student loan payments are set to resume, as the Supreme Court struck down President Biden’s loan forgiveness plan. The average loan repayment is estimated to be between $210 and $340 per month, and those between the ages of 25 to 49 years account for the largest share of borrowers (just over 60% of all borrowers and debt outstanding) with the most outstanding repayments.14 Following the Supreme Court’s ruling on June 30, President Biden announced several new initiatives to ease borrowers’ transition into repayment, including a 12-month “on-ramp” period when interest will accrue and payments will be due, but there will be no penalties for late payments.15 Biden’s new SAVE plan also aims to reduce monthly payments by $100 or more. While this plan may provide some relief, the seemingly fearless U.S. consumer may finally be shaken if loan repayments resume at the same time that excess savings run out.

Consumer strength is already showing signs of cooling. In May, non-revolving consumer credit contracted.16 This is only the second time that this has happened since 2011 (with April 2020 being the other month). Total consumer credit rose $7.2 billion in May or 1.8% year-over-year—the lowest monthly increase in borrowing since November 2020.16 Furthermore, the Johnson Redbook Index, an indicator of retail sales growth in the U.S., hit -0.4% in June, its only negative monthly reading outside of the global financial crisis (GFC) in 2008 and the pandemic in 2020.17
THE RUNNING OF THE BULLS (AND BEARS)
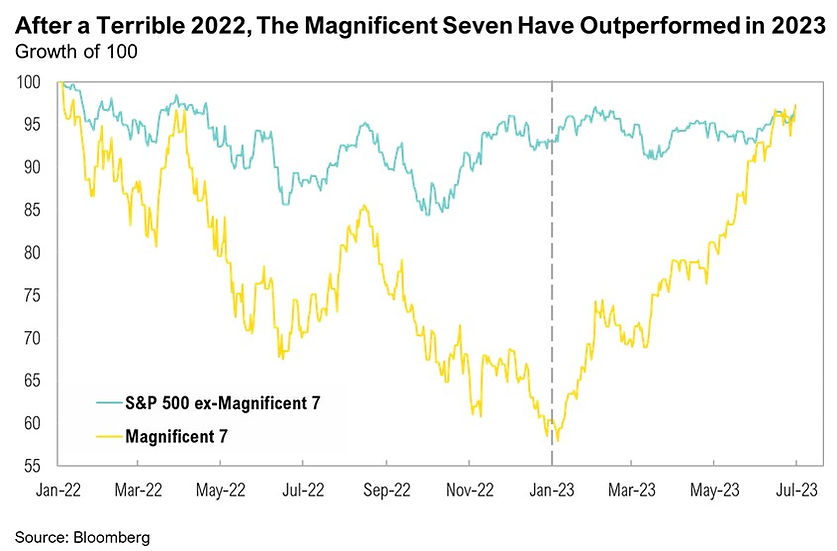
In January 2022, the S&P 500 began a slide that would ultimately become a bear market, triggered by decades-high inflation. Ten months later, on October 12, 2022, the S&P 500 hit 3,588. By June 9, 2023, the market rallied 20% from the October lows, largely driven by a rally in a small group of AI-related tech stocks, triggering the debate as to what kind of market we are experiencing. Although several signs point to a bull market, others suggest just the opposite, and investors are caught in the middle of a stampede of television talking heads who relentlessly alternate between promises of easy gains and predictions of impending doom.
The largest tech stocks in the U.S., a group of companies now collectively known as the Magnificent Seven (Meta, Apple, Alphabet, Nvidia, Amazon, Microsoft, and Tesla), have had a stellar year. These are the seven-largest listed U.S. companies, and together they have a collective market cap of $11 trillion—an astonishing amount equivalent to nearly half the GDP of the entire U.S.18,19 The Magnificent Seven were some of the worst performers of 2022, ending the year down more than 40%. In 2023, however, they have rallied and are up almost 70% year-to-date.
The buzz surrounding AI has been a key driver of the tech sector’s recent rally, and the Magnificent Seven are at the center of this excitement. Although AI is by no means new, the November launch of ChatGPT rapidly accelerated investors’ enthusiasm. Interestingly, even with the AI optimism, earnings expectations for 2023 and 2024 remain lower than they were coming into the year, down 4.7% and 2.5%, respectively.20
We are impressed with the rapid evolution of AI technology and its prospects for improving productivity, but there are still numerous questions surrounding monetization, as well as the implications for the broader labor market and the economy. While some excitement is certainly justified, we agree with this honest and insightful assessment from Datadog CFO David Obstler:
“I think it's too early. What we said that is, we don't know how this is going to go. The honest truth is the world—the software of the world doesn't know how this is going to be monetized, right?”21
The tech sector might have led the recent rally, but the all-important financial sector remains a concern. Following the collapse of three regional banks earlier this year, the sector remains under scrutiny from both investors and regulators. The banking sector also shows signs of ongoing stress. Usage of the Fed’s Bank Term Funding Program (BTFP) reached new record-high levels of more than $100 billion during the quarter, indicating that banks are still relying heavily on the Fed for liquidity. Banks also continued to tap into the Federal Home Loan Bank (FHLB) program, drawing an additional $800 billion and hitting an estimated total of $1.5 trillion over the past quarter.22 In the spring, the Fed eased access to its discount window in response to the collapse of Silicon Valley Bank in early March. Although usage of the program diminished during the past quarter, combined with BTFP it remains well above Great Financial Crisis (GFC) levels.
Regional banks in particular are bearing the brunt of banking sector stresses down more than 30% year-to-date. Furthermore, banks are also feeling the pressure from the cracks in the commercial real estate sector and concerns about increased loan defaults. There was a $2.8 billion quarter-over-quarter increase in non-performing loans (loans that are unlikely to be repaid in full)—the largest increase since the first quarter of 2010.23 In the first quarter of 2023, aggregate U.S. bank commercial real estate loans grew to $1.7 trillion and now comprise nearly 15.0% of total bank loans.23 With 97.8% of U.S. banks holding commercial real estate loans, an uptick in delinquencies would undeniably place further stress on this already-frazzled sector.
The real estate sector is also exhibiting both bull and bear dynamics. Helped by the Fed’s aggressive rate-hiking cycle, 30-year fixed mortgage rates ended June at 7.15%. Homeowners who purchased their homes during the past decade when rates were at record lows (2.9% in January 2021) are probably staying put. As a result, the number of existing homes for sale dropped by 7.1% in May to 1.4 million—some of the lowest levels on record and well below pandemic levels.24 Despite the drag of higher rates, demand for new single-family homes continues to increase. In May, new home sales increased by 12% month-over-month or 20% year-over-year.24 To attract buyers despite higher mortgage rates, homebuilders are offering discounts on mortgage rates. For example, Lennar has offered fixed-rate mortgages of approximately 5.0% to new buyers, and PulteGroup has offered 30-year fixed rates for as low as 4.25%.25 The National Association of Home Builders (NAHB) Index recorded the highest reading in almost a year in May, reflecting homebuilder optimism for new construction demand.26 As a result, share prices of some of the largest homebuilders in the U.S. have rebounded significantly from their October 12 lows: PulteGroup is up 99%, D.R. Horton is up 71%, and Lennar is up 64%. Share prices for these three homebuilders also reached new all-time highs over the past month.

Although residential new home sales are charging ahead, the commercial real estate sector isn’t faring as well. Elevated interest rates and a fundamental shift in the way people work and shop are taking a toll. During the past quarter, reports of large commercial properties (mostly offices) being marked down or returned to lenders increased. Blackstone sold 1330 Avenue of the Americas in Manhattan for $325 million—one-third less than the nearly $500 million it was purchased for back in 2006.27 Westfield, which has owned the San Francisco Centre Mall since 2002, has given the property back to its lender.28 Overall, U.S. metro office vacancy rates are now at a record-high 19%, surpassing rates during both the GFC and the pandemic.29
Furthermore, nearly $1.5 trillion in commercial mortgages are coming due in the next three years. Of these, 85.5% are interest-only loans, and given the Fed’s aggressive rate-hiking cycle, interest rates have more than doubled for some commercial mortgage payments over the past two years.30 According to Fitch Ratings, an estimated $35 billion of commercial mortgage loans due between April and December 2023 will not be possible to refinance, due to current interest rates, elevated vacancy levels, and plummeting property values.31 Some hotels are also starting to experience cracks. In June, Park Hotels & Resorts were forced to terminate payments towards a $725 million loan for two hotels, which was set to mature in November, and they are considering handing the keys back to lenders.32 According to Ashford Trust CEO Rob Hays, whose company has confirmed that they are handing over the keys of 19 U.S. hotels in several capital cities back to lenders:
“The challenging debt financing market for hotels has been around for months now and they are not getting any better.”33
Bull and bear market forces are also evident at the highest levels of the economy. The services sector in the U.S., bolstered by pent-up consumer demand and excess savings built up during the pandemic, remains robust. Activity in that sector has expanded for six consecutive months, albeit at a modest pace. The ISM Services PMI, a report that measures business activity for the overall economy, recorded a June reading of 53.934 (a reading above 50 indicates growth). Spending on services increased over the past two years, outpacing spending on durable and non-durable goods by more than 7% since Q2 2021.35 Further, personal consumption of services reached record-high levels in May, hitting $12.2 billion.10
The U.S. manufacturing sector, on the other hand, offers a sharp contrast. The June ISM Manufacturing PMI recorded a reading of 46.0, marking the eighth consecutive month of contraction in that sector.36 More importantly, every component in the ISM Manufacturing PMI registered a reading below 50, which indicates contraction. Since 1989, this has only happened on two other occasions—in 2001, following the dot-com bubble, and in 2009, during the GFC.
MARKETS
Both U.S. and international equity markets rallied in June to end the quarter in positive territory. Developed International ended the quarter up 3.2%, and the S&P 500 posted a respectable 8.7% gain. The quarter produced mixed results for fixed income, as yields continued to march higher and the Fed showed little sign of easing rates. The Bloomberg U.S. Aggregate Bond Index closed the quarter down 0.8% while U.S. bank loans ended the quarter up 3.1%. International developed market bonds were hit the hardest, ending the quarter down 2.1%.

Throughout the quarter, Japan remained steadfast in its ultra-easy monetary policy stance, despite concerns the new governor of the Bank of Japan (Kazuo Ueda, who started his term in early April) may be forced to adjust the country’s longstanding monetary policy stance. Since the start of this year, the BoJ has spent around $205 billion in quantitative easing efforts. Japan’s inflation remains near four-decade highs, and May core CPI registered 3.2% year-over-year, its ninth consecutive month with inflation above 3.0%.37 Core-core inflation (which excludes fresh food and energy) in Japan accelerated to 4.3% year-over-year in May—the highest core-core inflation reading since June 1981.
Following the reopening of China’s borders in January after three years of COVID-19 restrictions, the country’s much-anticipated economic recovery seems to be running out of steam. China’s manufacturing sector recorded three consecutive months of contraction in the second quarter. Furthermore, inflation in China cooled to the slowest pace in two years, underpinning weak domestic demand. In mid-June, The People’s Bank of China cut a key policy rate and injected more than $3 billion into the country’s financial system, indicating that Chinese officials are increasingly concerned about the country’s rapidly slowing rate of recovery.38 The MSCI China Index is down 5.5% year-to-date.
The United Kingdom continues to battle decades-high inflation levels. Inflation in the U.K. increased by 8.7% year-over-year in June, and the Bank of England responded with a 50 basis-point hike in its official bank rate, which is now at 5.0%. European natural gas prices ended June almost 30% higher, marking the highest monthly gain in a year.39 Natural gas prices have remained volatile since Russia’s invasion of Ukraine, despite healthy inventory levels. Gas storage sites are now 77% full, and demand has moderated due to milder weather. The Stoxx Europe 600 Index is up 13.9% year-to-date while the FTSE 100 Index is up 8.5% year-to-date. The U.K. Government All Bonds Index is up 1.0% year-to-date.
LOOKING FORWARD
If this is a bull market, conventional wisdom suggests that the stampede could go on for years and investors should join in, or risk being left behind. This rally could, however, be just one of the many bear market rallies we have experienced in the past—one that has been extended by the unusual war chest of cash amassed during the pandemic. If that is the case, then investors should still run—but for the exits instead. So, what is an investor to do?
Unlike the stream of overzealous bulls and bears parading across media channels, we can choose to entertain both potential scenarios; in fact, wise investors must do so. They should always construct portfolios that can withstand more than a single outcome, and today’s economic indicators suggest this practice may be more important than ever. Our goal is to be prepared for either outcome.
PERFORMANCE DISCLOSURES
All market pricing and performance data from Bloomberg, unless otherwise cited. Asset class and sector performance are gross of fees unless otherwise indicated.
CITATIONS
-
Federal Reserve: https://www.federalreserve.gov/newsevents/pressreleases/monetary20230614a.htm
-
Federal Reserve: https://www.federalreserve.gov/newsevents/testimony/powell20230307a.htm
-
Reuters: https://www.reuters.com/technology/global-markets-flows-urgent-2023-06-02/
-
Nasdaq: https://www.nasdaq.com/articles/wall-street-legend-bob-farrells-10-rules
-
NY Times: https://www.nytimes.com/2023/05/29/us/politics/debt-ceiling-agreement.html
-
Federal Reserve: https://www.federalreserve.gov/econres/notes/feds-notes/excess-savings-during-the-covid-19-pandemic-20221021.html
-
BCA Research: https://twitter.com/LizAnnSonders/status/1676564054209441793
-
Walmart: https://s201.q4cdn.com/262069030/files/doc_earnings/2024/q1/transcript/Q1-2024-Earnings-Call.pdf
-
WSJ: https://www.wsj.com/articles/student-loan-repayments-deadline-economy-913acc34
-
Federal Reserve: https://www.federalreserve.gov/releases/g19/20230710/
-
Investing.com: https://www.investing.com/economic-calendar/redbook-911
-
Markets Insider: https://markets.businessinsider.com/news/stocks/magnificent-7-11-trillion-market-value-triple-gdp-germany-tech-2023-7
-
FactSet: https://insight.factset.com/sp-500-earnings-season-update-july-14-2023
-
The Transcript: https://thetranscript.substack.com/p/06-12-2023-non-recession-recession-free
-
BankRegData: https://www.bankregdata.com/main.asp
-
Redfin: https://www.redfin.com/news/housing-market-tracker-may-2023/
-
Axios: https://www.axios.com/2023/02/23/homebuilders-mortgage-rates-horton-lennar-pulte
-
NAHB: https://www.nahb.org/news-and-economics/housing-economics/indices/housing-market-index
-
Financial Times: https://www.ft.com/content/658d937f-f804-4656-a9d8-428b9c2c917d
-
NY Times: https://www.nytimes.com/2023/06/14/business/westfield-mall-sf.html
-
FDI Intelligence: https://www.fdiintelligence.com/content/data-trends/out-of-office-us-vacancy-rates-hit-record-high-82348
-
CoStar: https://www.costar.com/article/1404491410/ashford-trust-plans-to-hand-back-keys-for-19-us-hotels
-
Deloitte: https://www2.deloitte.com/us/en/insights/economy/spotlight/consumer-spending-inflation-services.html
-
ISM: https://www.ismworld.org/supply-management-news-and-reports/reports/ism-report-on-business/pmi/june/
-
WSJ: https://www.wsj.com/articles/chinas-central-bank-cuts-key-policy-rate-63d26f56